Posts

Showing posts from January, 2023

“higher interest rates will kill the housing market” narrative

Image
“higher interest rates will kill the housing market” narrative Check out the chart below. I plotted U.S. house prices overlaid with interest rate hiking cycles. The chart goes back to 1987. Every shaded area represents a hiking cycle – which in this chart is any period when the Fed raised rates at two or more consecutive meetings. Successful trader shares access to #1 strategy for 2023 And during every hike cycle, house prices in the U.S., as measured by the FHFA U.S. House Price Index, went up… Not down. During the 2022 hike cycle (which isn’t over yet), house prices appreciated at the fastest rate in decades. So much for the “higher interest rates will kill the housing market” narrative.
Dollar was going to bounce

Image
  Dollar was going to bounce Here's what the Dollar Index looks like now: This is about the 50% retracement of the entire move off the lows in 2021, and it was also support last Spring. If the Dollar was going to bounce, this would be a logical place for us to see some demand come in.

HeatMap Monday 30 Jan - Massively down day in all areas

Image
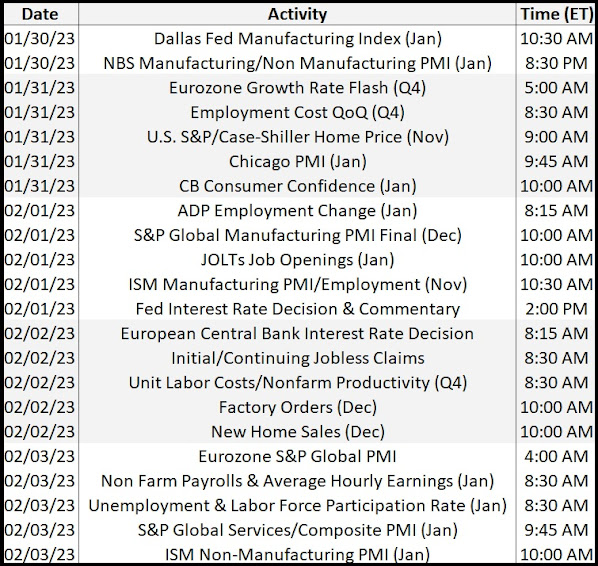
 HeatMap Monday 30 Jan - Massively down day in all areas Only one sector closed green. Consumer staples (+0.14%) led, and energy (-2.25%) lagged. 💚 In economic news, the  Dallas fed manufacturing  index rose from -11.6 to -8.4 in January as manufacturing activity remains weak. On the note of manufacturing,  Boeing plans to add  a new 737 MAX production line in Everett, Washington, as travel demand keeps its backlog strong. 🏭

Week 5

Image
 

Week 4

Image
 

Asset Allocation

Image
Asset Allocation Since 2008, international stocks—both in developed countries and emerging markets—haven’t fared well compared to US equity, real estate, and fixed income. They have returned less than their counterparts, even when we include US investment grade and high-yield fixed income. In the graphic below, you see the returns of various asset classes going back to 2008. The only thing doing worse than international stocks was cash. Source:  https://novelinvestor.com/asset-class-returns/ However, in our conversation, Peter Boockvar points out certain macroeconomic variables that could turn into tailwinds for these stocks and reverse the longstanding trend. You don’t want to miss his take on the best investment opportunities for 2023.

Heatmap Friday 27th Jan 2023

Image
Heatmap Friday 27th Jan 2023 The whales are out playing stocking the market up before the wind is taken out of the sails on the day of the FED meeting.  Check out today’s heat map: 5 of 11 sectors closed green. Consumer discretionary (+2.28%) led, and energy (-2.01%) lagged. 💚 Electric vehicle stocks soared today as investors continued to digest Tesla’s earnings report. Additionally, Saudi Arabia fund  takeover speculation  sent Lucid Motors up as much as 100% at its highs before settling at +43%. ⚡ Consumer products giant Colgate sunk 5% despite  earnings beating  expectations. Like its competitors, it appears to be facing significant margin pressure even as it raises prices. 🪥

Trend to the upside

Image
 Trend to the upside To be clear, the list of Sectors in uptrends kept getting longer throughout the 4th quarter, not shorter. And so now here we are, with all of those sectors still above their 200 day moving averages. But you can also add Technology and Communications to that list as well. Yes I'll say it again,  Technology and Communications  - some of the worst-performing groups in the world over the last couple of years. Let me ask you this: Are we seeing more stocks going up? Or is the list of stocks going down getting longer? Are the leading sectors holding in the best rolling over to catch down to the losers? Or are we seeing rotation into the laggards that are catching up to the former leaders?

Governments can always get monies

Image
Governments can always get monies For bond  interest  payments due, the Treasury receives far more in monthly tax receipts than it owes in monthly interest payments. As of the end of fiscal 2022, interest payments due on U.S. Treasuries accounted for just 9.7% of total tax revenue. This is akin to making $10,000/month in salary and having a $970/month mortgage payment, which would of course be easily manageable. The U.S. Treasury Receives Enough in Paid Taxes (blue bars) to Cover Interest Payments on Debt (red bars)  

Commodities are still cheap

Image
Commodities are still cheap

Growth thru consumer borrowing is not good

Image
 Growth thru consumer borrowing is not good As for imports, the idea that importing goods should subtract from GDP is absolutely nuts, if we are to believe that GDP is supposed to be some kind of measure of output. One would suppose that we would have graduated past late-19th-century notions of national autarky and realized by now that trade with other nations is a good thing but nope.  We need to get the government is loosen the tax burden to promote spending and investment in these difficult times.  We need to identify and make all areas of daily life secure.  Food, Health, Wealth, Energy, Retirement, Education, Security.

Thursday 26 Jan 2023

Image
Thursday 26 Jan 2023 Massive movement in technologies up to closer, bad Intel report pulled some off the table.  A good start to seeing semiconductors back as AI and Cloud will dominate in the future.  Today’s issue covers  more tech and media earnings, confusing economic data, and what payment processor earnings say about the consumer.  📰 Check out today’s heat map: 10 of 11 sectors closed green. Energy (+3.16%) led, and consumer staples (-0.35%) lagged. 💚 Bed Bath & Beyond plummeted 22% after confirming it  doesn’t have enough cash  to pay down its debts. It’s also already in default on its credit line with JP Morgan. 🏦

Wed 25 Jan 2023

Image
 Wed 25 Jan 2023 Check out today’s heat map: 8 of 11 sectors closed green. Financials (+0.78%) led, and utilities (-1.35%) lagged. 💚 In economic news, Interest rates continue to  drift lower  ahead of next week’s Fed meeting. Up north, the Bank of Canada  raised interest rates  by another 0.25%, hinting that it may pause hikes for now. And  Australia’s inflation rate  hit a new 32-year high of 7.8% in the fourth quarter, reiterating that some countries are still struggling to subdue prices. 🌡️ People are more confident that companies are managing balance sheets correctly and OPEX, i expect a gradual greed coming back into the market.

HeatMap Tues 24 Jan 2023

Image
HeatMap Tues 24 Jan 2023  We are very near to the 200 DMA and together with the reduction in staff in a number of companies to tech index has marched forward.  The number of companies pairing staff is not set to stop anytime soon as the hire/fire mentality is still in a number of companies. Look out for the tech companies that are hiring these sparse resources which will make it harder and more expensive for those companies that need to regain staff at a later stage.  They will have a plaque that says that they will not look after staff in good times and bad. Check out today’s heat map: 6 of 11 sectors closed green. Industrials (+0.66%) led, and health care (-0.66%) lagged. 💚 In economic news,  U.S. business activity  contracted for the seventh straight month in January though at a moderating pace. The  Richmond Fed index  also showed a slight contraction in activity in January after notching a small gain in December. And  in the eurozone , the purchasing managers’ index (PMI) rose to

fiscal year 2023

Image
fiscal year 2023 The big different between mandatory spending and discretionary spending is that the former is mandated by existing laws, while the latter is not. The mandatory spending on only Social Security and Medicare account for approximately 31% of total government spending in fiscal year 2022 or almost $2 trillion in total. When you add in all mandatory spending categories, it accounts for about 60% of the total government spending in a given year. This percentage has basically doubled since the 1960s and simultaneously cut discretionary spending in half. When we look at spending by agency, it is shocking to see spending by the Department of Health and Human Services is double the Department of Defense (military spending) and the Department of Homeland Security combined. Additionally, we spend double the amount on Social Security compared to the Department of Education. For discretionary spending, the US government has historically split spending 50/50 between defense-related s

Pre-Election Cycle

Image
 Pre-Election Cycle Since 1950, whenever the S&P500 has completed the Trifecta coming off a down year,  the stock market has  never  been down . And it's  up almost 27% on average , more than 3 times the average annual rate of return for the S&P500. And this makes sense considering we just entered the Pre-Election year, historically the most bullish part of the 4-year cycle: Stocks have been following these seasonal trends as closely as I can remember. Everything points to a difficult time but the main indexes will go up as in previous years.

Market Movement - Week4

Image
 Market Movement - Week4 The positive news is that within two days the S&P 500 (SPY chart below) bounced from its swing low and crossed above the recent swing high. We’re still butting up against resistance and while I think we could see higher movement on earnings this week, I think we’re overbought and due for a pullback. While the market has had some powerful up days, the gains over the last five days have been limited to four out of the eleven S&p 500 sectors and largely from earnings and upgrades. It would be nice to see the broader market also participate. Ok, Let’s see if we can find a trading candidate for today.

The 18.6 Year Cycle Hasn’t Failed for 231 Years

Image
  The 18.6 Year Cycle Hasn’t Failed for 231 Years Stock markets… bond markets… real estate… all follow cycles. And I have been researching them for decades. For instance, did you know that every 18.6 years… since 1792… stock markets peaked, fell, and entered panics in consistent cycles? Take a look at the chart below. It tracks commodity cycles since 1792. (Click here to expand image) Or did you know that at the bottom of the cycle, new industries emerge, led by next-generation entrepreneurs? The cycle predicts that, too.

index’s trajectory continues to signal a recession ahead

Image
index’s trajectory continues to signal a recession ahead While most of the ten components fell in the second half of 2022, the weakness in non-financial components drove the overall decline. 📉 While these declines were more or less expected, what has investors worried is that  the index’s trajectory continues to signal a recession ahead.  And while no forecasting system is perfect, this one has a pretty good track record. 

HeatMap Monday 23rd Jan 2023

Image
 HeatMap Monday 23rd Jan 2023 Today’s issue covers  the top stories in tech, the conference board’s leading economic indicators, and more.  📰 Check out today’s heat map: Every sector closed green. Technology (+2.31%) led, and utilities (+0.04%) lagged. 💚 Internationally,  Japan’s financial troubles  continue to intensify as the Bank of Japan struggles to keep yields down. Brazil and Argentina are in talks to  further their economic integration  by taking steps that include the development of a common currency. And  eurozone consumer confidence  ticked up modestly in December as their energy prices and economic outlook improved. 🗺️