Think of the yield curve simply as an economic barometer.
Think of the yield curve simply as an economic barometer.
The curve tends to slope up when investors are optimistic about future economic growth. It slopes down – and eventually inverts or goes below zero – when they see slowing growth ahead.
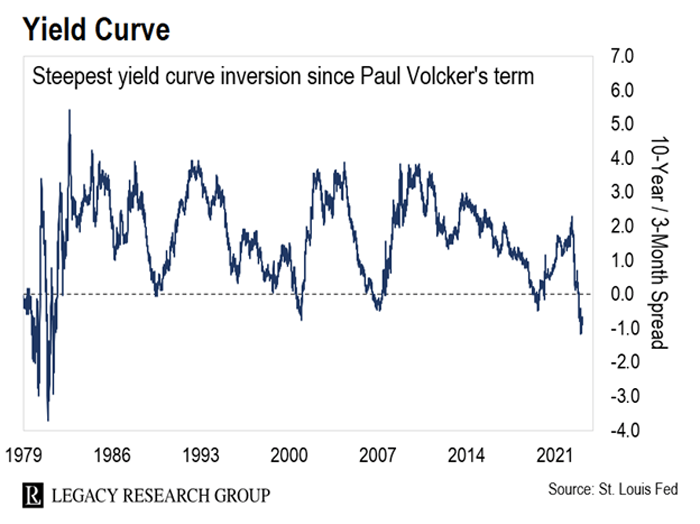
And as you can see in the chart below, the yield curve hasn’t been so steeply inverted since Paul Volcker was running the Fed more than four decades ago.

He’s remembered as the guy who slayed the inflation of the 1970s by jacking up interest rates into double digits. But he also triggered the “double-dip” recessions of the early 1980s.
This has predicted past recessions with staggering accuracy…
It’s all in this next chart from Credit Suisse. It shows how each yield curve inversion (readings below 0) has preceded a recession (gray shaded areas).

There’s a lag between the extreme inversion readings (red circles) and the recessions that follow.
But like clockwork, after every inversion, the economy has hit the skids.
Comments
Post a Comment